Tuesday, August 26, 2014

It Takes Two To Tango

The S&P500 closed today above 2000 for the first time, marking a major milestone in the post-implosionary bull market of 2009. No doubt, traders are nervous of the melt upwards in US indexes as the Fed trims their balance sheets. Perplexingly, the $VIX still indicates a degree of complacency relative to the year:

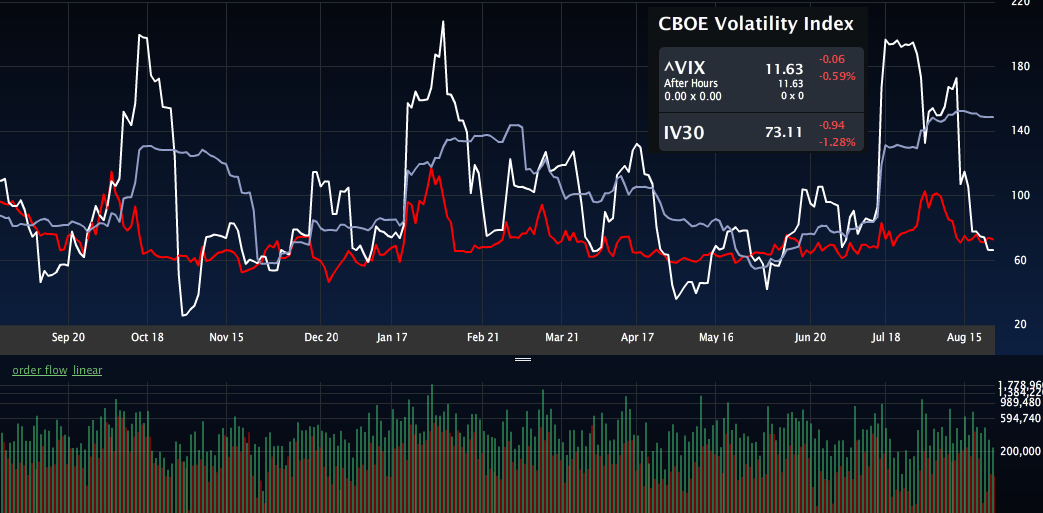
The VIX as of today's close. HV10: White; HV30: Gray; IV30: Red
The short-term realized volatility of the VIX (IV10) has retraced levels seen prior to the brief scare in July where markets become suddenly lucid of the risk that Ebola, Russia/Ukraine, and ISIS posed. Markets are not entirely discounting that risk however, as the 30-day forward looking implied volatility sits elevated relative to the near-term historical (HV10 specifically) volatility. Looking at the increasing trend of sales in put options on the fear index shows that some are willing to bet that volatility still has room to go down.

The S&P500 itself has been flirting above and below the 2000 milestone for the past two days, showing uncertainty of whether this millennial mark can maintain despite the trimming of the Fed's balance sheet and the looming possibility of interest-rate risk.

$SPY: HV10: White; HV30: Gray; IV30: Red
The sideways action of the S&P500 is reflected in the very diminished 10-day realized volatility, however Wall Street is starting to place their bets.

Below is the options skew for $SPY:


Based on options sales in the $SPY, one trader is betting on S&P upside to the 2002.5 level with the purchase of 5200 call options on the index. This level acted as strong resistance in this afternoon's trading.

Largest sales in the $SPY today

On the flip-side, a bearish ante was upped today with the sale of a 10,000 put option spread for the 19300 and 19900 levels. This trader is betting on downside retracement to the levels seen earlier this month before the magnificent 65-handle, 10 trading day rally:


From either perspective, bet on increased chop in the days ahead.

Largest VIX sales for Aug. 26, 2014
A 15000-lot 18/23 call spread was opened today for the Oct. $VIX expiry. For those of you betting on increased volatility as we head into the fall, the current 30-day implied volatility of the VIX sits near 70, which indicates that the IV30 of the VIX has only been lower 33% of the time.

Good luck tomorrow.

Sunday, August 24, 2014

An Irrationally Exuberant Approach To Biotechnology

Frothy Valuations in the Markets and You
August 24, 2014

We learn from our mistakes, at least I hope we do. Below is a chart comparing four of the biggest "bubbles" in US market history:

Courtesy of Macrotrends.com

I'm going to refrain from using the term "bubble" and instead use "irrationally exuberated price discovery". Often times in these moments, it drives rational agents to act not so rationally. Looking at the chart above, we see an almost identical explosive rise in prices followed by an equally rapid decline regardless of the asset class. There are myriad factors (known and unknown) that contribute to the exuberance but I'd like to focus on one particular case: excessive speculation.

Below is a chart of bitcoin:


We cannot deny the fact that no one really knew what bitcoin was worth last year. In a span of less than a week, we saw highs just north of $1100 and a near 50% collapse. At the time, the digital currency was, in my opinion, nearly useless. It really couldn't be used as actual currency since it wasn't really adopted. There was a single cafe in Palo Alto that accepted bitcoin but a $3 dollar cup of coffee may have actually cost you $10 the next week due to price volatility. I suppose it was good for money laundering.

So now we arrive at the biotechnology sector. Here is a quote from Yellen herself earlier in July:

Nevertheless, valuation metrics in some sectors do appear substantially stretched—particularly those for smaller firms in the [...] biotechnology industries, despite a notable downturn in equity prices for such firms early in the year.

Let's take a closer look at valuations in the small cap biotechnology sector vs the S&P500:

Price of small-cap biotech vs. S&P500. Source: Ameritrade TD

Year-to-date, Ameritrade's small cap biotech index has risen almost 20% above the S&P500. Is there a problem with this?

To answer this question, let's take a look at what the S&P500 is actually indexing.

The S&P500 is a stock market index based on the market capitalizations of 500 large companies having common stock listed on the NYSE or NASDAQ - Wikipedia

So the S&P500 essentially tracks the prices of generally well established, dividend-paying components of American markets such as Boeing, Berkshire-Hathaway, Coca-Cola, etc. Let's look at some components in the small-cap biotechnology sector:


The above list is the first page of Ameritrade's listing in the sector, arranged with descending market cap. Immediately, you notice that of the 22 companies on this page, only 8 actually have a listed P/E ratio, indicating that only 8 of the largest companies (by market cap) in this sector generate positive revenue to even have a price/earnings ratio listed. Additionally, only two companies in this entire index pay a dividend (PDLI ~ 6% and AMGN ~2%).

So why is this sector popping? Investors sure aren't receiving any meaningful dividends from these components. Instead, they are speculating on the future worth of these companies, which can pay a handsome reward if $PBYI (Puma Biotech.) serves as an example:


However, Puma is an outlier, no doubt. Not all of these companies will explode 5-fold in price overnight. In fact, a lot of these companies will fail to pass any of their products to public markets and will be acquired/liquidated at a net loss to investors.

$TKMR, Tekmira, developing a potential Ebola vaccine that barely skidded its way into clinical trials due to urgency saw speculative buying, and a lot of buyers in the stock got burned.

Notice the similarity in price action to bitcoin?

Tekmira made a public offering earlier this year at $28. That price, for a company that has yet to generate positive cash flow. It closed today at $17.74. Tekmira is typical of what a lot of the small-cap biotechnology sector currently looks like. No positive cash-flow and sky-high P/E's and valuations. Now let's look at the NASDAQ's Biotech. Index Fund ($IBB):


See a pattern emerging? The average P/E of components in this ETF is approximately 40, whereas the average P/E of all stocks publicly traded in the US is about 19. Here is NASDAQ's page on this ETF that lists some statistics and components of the fund.

If history serves as an example, I see a lot of similarities between today's biotechnology sector and the NASDAQ of the early 2000's. Investors were shooting valuations of any company with a .com domain name sky-high regardless of whether they had any sound fundamentals or even a sensible business model for that matter.

Having gone through the .com bubble, investors are of course more cautious in exhibiting such exuberance in the year 2014. However, in my opinion, I think that history may be repeating itself. Having worked in the pharmaceutical industry, I've seen many "promising" drugs fail late stage pre-clinical trials from some of the best publicly traded pharmaceutical companies. Furthermore, it's not even unusual to see drugs fail late-stage clinical trials.

In a previous post, I talked about how Wall Street "prices-in" shares in pharmaceutical companies with the assumption that their drugs will successfully pass clinical trials. If this weren't true, we would never see drastic price crashes upon announcements of clinical trial failures.

Having said that, no one can be 100% certain of what any asset is really worth. It may be the case that the biotechnology sector is fairly valued, but it also could be not. As we head into the Fall, keep in mind that 5 years of economic stimulus is coming to an end and that the risk of increased interest rates becomes more and more palpable with every passing minute.

Good luck this week.


#biotechnology, #ebola, $TKMR, $PBYI, $AMGN, $IBB

Tuesday, August 19, 2014

Tesla Contracts: Get 'Em While They're Hot

Contracts in Tesla are currently sitting at an implied volatility of 35.97, which indicates that Wall Street saw risk in owning shares in the company lower only 2% of the time since its IPO in 2010. A brief look at a chart in $TSLA shows pretty drastic price action this year, action that might suggest that options in Tesla may be underpriced.

Red, white, and blue moving averages. The three parallel blue lines outline the "trend" in Tesla.

One thing we do know about volatility is that it is mean reverting. Mean reversion is a phenomena that occurs quite frequently in nature. When the behavior of a system is displaced from equilibrium, it will tend to revert back to the state prior to displacement. For instance, a vibrating guitar string will not ring forever: after it is plucked, it will return to a state of equilibrium (which in the case of the string is "at rest").

This analogy applies analogously to volatility in markets. States of frantic selling or buying are only momentary; markets will eventually want to revert back to a state of equilibrium, or in other words, revert back to its mean. In terms of movements in stock prices, mean reversion can be seen by drawing a "trend line". I estimated the trend line for price action in Tesla with the three parallel blue lines up above. As you can see, each time price diverged from the central line, it had the tendency to move quite drastically above and below it, only to return to it.

One of my favorite assets, the $VIX, which is literally an index of volatility itself, demonstrates that it is indeed a mean reverting phenomena.


I applied a linear regression to the index. As you can see, market volatility tends to return to the central trend line of mean reversion. Irrationality transforms to price discovery which transforms to price stability as global markets learn from trial and error.

As of today, August 19th, the markets have returned to the central trend that Tesla has been wanting to revert to. Wall Street, at this point and time and with all known information regarding the company, generally agrees on a price around $255 a share.

I must re-emphasis the phrase "all known information". Tesla traded near this mark around Feb/March of this year, but at the time, there was very little information regarding its market operations in China or its soon-to-be gigafactory. A disappointing earnings report Q1 2014 caused a frantic sell-off in the stock to about $180 before markets got their metaphorical shit together and realized a bargain was at their hands. The price reverted back to its trend line in July.

Fast-forward to today and markets agree that $255 is an acceptable price now knowing of their intents in China, expansions in the US infrastructure, and production capacity. All these variables are currently "priced-in" to the stock.

However, as speculators, option traders now have one of the biggest opportunities to profit off of price movement in the company. From a volatility perspective, options in the company have only traded cheaper 2% of the time.

Notice that the implied volatility of share in Tesla also has a mean it reverts to (~50% IV)
A quick look at the implied volatility of shares in Tesla shows that options are "cheaper" than they have been in quite a while. This is for a company that many people believe can be the "next big thing", and not to mention, is very young. Unlike Apple, which has been publicly traded for decades with multiple splits, the amount of available shares in the company are relatively few. The sale of a single share in the company has the ability to move the price more drastically than shares in any NYSE component.

That being said, shares in Tesla won't implode/explode today or tomorrow, or even by the end of this month necessarily. What the take home point is that at some point, we know that volatility will increase in the company. As you may or may not know, option traders have the ability to construct a delta neutral position that exposes one only to volatility in movement and not directionality of price. But for those of you so inclined, you can "cheaply" speculate on the future price of Tesla.

Place your bets on Wall Street.

Sunday, August 17, 2014

What's In Store This Week, Lady Wall Street?

The S&P500 moved a whopping 1 point downward last Friday after seeing a high of 1964 and a low of 1942. A brief mid-morning rally that breached the critical 1960 resistance came to end when news of trucks exploding in Crimea caused a sell-off in the indexes. The 1940 level acted as support before the S&P rallied to close the day at 1955.

The week closed with a bullish bias with the the $VIX 30, 50, and 100-day moving averages acting as resistance. The 30-day forward looking volatility for the VIX rests around 84, after seeing highs near 120 in early August. The current value of VIX, 13.15, implies that the markets expect roughly a 3.75% movement in the S&P500 in the next 30 days, while the IV of the VIX implies a 24% movement in the volatility index itself.


Looking forward this week, expect some volatility from economic reports, notably the CPI, FOMC minutes, and home sales.

Sources: briefing.com, Risk Laboratory

On the Ebola front, Tekmira Pharmaceuticals ($TKMR) reported earnings last week, missing the consensus EPS estimate of -$0.26 by 2 cents to report a quarterly decline of -$0.28. Shares in the company developing the most promising Ebola vaccine dropped to $16.10 after reports of the miss, only to recover near its pre-earnings price just north of $18.00. Last week, I talked about how markets were pricing the risk of Tekmira pharmaceuticals. Based on the implied volatility, one could extrapolate a rough $2.75 movement in the stock from its pre-earnings price of $18.60. The stock did just that early Friday morning, only to see an explosion right back above $18.00 to close the week. It looks like someone didn't want the put options they sold in $TKMR to expire in-the-money.


Below is some data behind the current Ebola outbreak.


Like most naturally occurring phenomena (think bacterial reproduction, compound interest, user rate growth), the exponential increase in deaths and cases suggests that the current strain has reached "outbreak" status and does pose significant risk to the current geopolitical landscape. However, $TKMR is still currently priced with speculation that its vaccine will be succesful, but let's keep in mind that the company has yet to generate any sort of revenue. That's not to say that the stock price won't still go up, but due to the nature of human behavior and risk perception, there is still a lot of room for movement in the stock (be it upwards or downwards).

As of 8:30 PM EST, the S&P500 has yet to breach the 1960 support. Expect strong resistance at this point from last Friday's brief rally. Let's take a look at the options skew for $SPY:


Traders expect the 1960 level to show strong resistance, with strong speculation that the US indexes will kick off the week with downward action as far as 1935.5. A contrarian who bets that the S&P500 will breach 1960 may receive a handsome profit from their speculation based on the current pricing of $SPY calls.

Below is the option skew for $VIX:


The $VIX confirms that markets are weary going into the week. However, looking forward to September's expiration, one might be able to extrapolate weakening pessimism/growing optimism as August comes to a close.

Courtesy of CNN
CNN's fear 'n' greed meter shows a slight easing of fear from one week ago which the 6-point drop in the $VIX last week can confirm.

Going into this week, be cautious that geopolitical volatility may erupt like it did Friday morning. Hedge accordingly.

See you at tomorrow's opening bell.


$VIX $NDX $COMPQ $SPX $SPY $RUT

Thursday, August 14, 2014

From S&P Dusk Till Dawn

As we head into fall, the S&P500 and VIX have continued their respective churn up and retreat back. The end of the world was briefly interrupted today when Russia extended their proverbial olive branch with promises to ease aggression in Crimea, slamming crude oil futures further down 2 handles. The brief escalation in the VIX retreated back down, breaching critical points of support to close today at 12.42 with a 30-day forward looking volatility of 56.96.


The S&P advanced 45 points since last Friday, rejecting the 1910 support and spurning it upwards to the next critical point of 1960. Let's take a look at some options skews:

Options skew in $SPY
Above is the options skew for $SPY representing the weekly expirations for August. Looking at tomorrow's expiration (the white curve), we can extrapolate that Wall Street is expecting one of two things for tomorrow (Friday):

1. Traders are expecting the S&P500 to reject the 1960 level and retreat downwards with the 1945.5 to act as the first level of support. Some are pricing in the possibility of a further waver to 1935 with a 6% probability (based on the .06 delta for the weekly expiration).

2. Another group is betting on the possibility that the bulls will defeat the 1960 resistance and finish the week with a rally.

Let's look at what the $VIX has to say:

$VIX with this Friday's and Sept. expirations

The $VIX weighs the possibility of a 1960 level rejection higher than a rally based on tomorrow's expiration. Looking at September's expiration, traders are taking the position that in the slightly longer term, the S&P might be out of fuel for a rally or that some of the temporary decline in geopolitical escalation will not last.

Let's not discount the fact that this year has seen the use of a very popular strategy called the short-squeeze. With the increased level of anxiety in the markets as of late, traders have been covering their long positions with puts and shorts. The bigger players have been calling out the bluffs by churning equities and index highers, causing bears to cover their shorts.

Don't get fleeced; see you at the opening bell.


Tuesday, August 12, 2014

Tekmira Pharmaceuticals and a Lesson in Stock Volatility

Tuesday, August 12 - Shares in Tekmira Pharmaceuticals (TKMR) imploded 22% after today's opening bell with a 3.75% drop after-hours. That's a single-day drop of nearly 26%. Put another way, the market capitalization of the company fell $130,000,000 in about 10 hours and put even another way, the market's perceived worth of the company fell by more than a quarter of its total worth from the time someone drank their morning coffee to the time they left work.


Yesterday, I talked about how one could extrapolate from the options skew that the only direction shares in TKMR could go from yesterday's close of $24 is downwards. Since then, Wall Street's expectations for the company changed again. Let's take a closer look:


Above is the options skew for Tekmira at the end of today's trading day. Below is what the skew looked like before today's opening bell.


Yesterday's volatility smirk has evolved into a slight grin and maybe even a smile after today's drop of about 25%. What can we extrapolate from this?

At it's current share price of about $18, the markets are starting to believe that shares in the company might be worth more. Remember from yesterday, we could extrapolate that Tekmira is worth approximately $23 a share to the market if we assume that their Ebola vaccine will successfully pass clinical trials and be available to the public. With today's development of more perceived upside risk in the company, we can extrapolate that the markets are starting to believe shares in the company might be undervalued at $18. But there is an extra factor that I didn't talk about at all yesterday that we now cannot ignore.

Tekmira reports earnings after tomorrow's closing bell. In the theoretical word of derivatives, the implied volatility of stock options in a company should increase as we approach quarterly earnings. However, we saw a 20% decay in the IV today. This, in my opinion, was probably due to the decay of euphoria surrounding the news of TKMR's Ebola vaccine fast-track status that hit the press yesterday. However, even considering today's decline of panic buying in Tekmira, I believe that the implied volatility should have still increased.

The implied volatility roughly translates to the market's expectations of how "volatile" a stock's price will behave in the near future. Considering that, after an implosion of more than 25% in a single trading day, shouldn't the implied volatility have gone up instead of down? Also, let's not forget that since yesterday, we are now less than 24 hours away from earnings.


That, of course, is how the IV should behave in theory but we all know that theory never fully translates to practice.


Queuing the at-the-money straddle for this week's expiry, we can extrapolate that the markets expect +/- $2.75 price movement in the stock by Friday's closing bell. Really? The stock dropped more than $5.00 today alone, not to mention that the company made a public offering in March of this year for $28 a share. Yes, $28.

Keep in mind, this is not a trade recommendation. I could be wrong and the markets may be efficiently pricing the risk of $TKMR properly. But they could also be not.

Place your bets on Wall Street.


$TKMR, #ebola, #volatility

Monday, August 11, 2014

Ebola and the Volatility of Market Speculation

Tekmira Pharmaceuticals (TKMR) is currently the only company in the world that has access to a potential treatment for Ebola. Due to the urgency of the current Ebola outbreak, the FDA has removed a hold on its development through its phase 1 clinical trials in hopes of allowing faster public access to the potential vaccination. For those of you not familiar, phase 1 clinical trials are the very initial process where an experimental compound sees its first tests on humans. Prior, all testing is done on animals with primates being the last before exiting preclinical status.

Shares in the company have exploded from its July low of $8.86 to close today at $23.80 after seeing intra-day highs of $26.00. That is over a 2.5x price increase in less than a month.


This serves almost as a perfect example for the speculative trading that the markets have evolved into in this modern age, and as always, there can be lessons learned. Let's take a closer look:

At the end today's trading day, Tekmira's 30-day forward looking volatility sits at a handsome level of 158, which represents a higher implied volatility than 100% of the time in its past. This can be roughly translated to "the markets are speculating a 30-day move in the stock price greater than any time in the history that TKMR has been offered publicly to trade."

Implied vol. mean index of Tekmira

All this speculation on a drug that has only been tested on monkeys. (Author's note: Having worked in pharmaceutical development, results in primates often times don't translate very well to humans.) That's not to say that the vaccination will not produce positive results in humans, and I hope it does, however the speculation that is rampant typifies high volatility-high momentum stocks that we are all familiar with from the NASDAQ in 2001 and Twitter this year. The markets are essentially "pre-buying" the stock in anticipation of the future cash flow Tekmira may potentially generate from successful application of their experimental vaccine in humans. This is often called "pricing-in" or "discounting".

Let's look at the skew chart for options in Tekmira:


The skew chart shows nearly only down-side risk for the company, both near-term and long-term. Essentially, the current price of the stock (arguably) already reflects the fact that their vaccination will be successful in humans, else there would be at least some up-side risk reflected. Instead, we see the volatility smirk instead of the smile (how appropriate the terminology). As of the end of today's trading day, by next March, the markets only expect the price of the stock to go down. How devious.

So what is the lesson? If you think that the vaccine will be successful in human studies, it is already too late to buy the speculation. In fact, if you had bought the stock today near its intraday high and the company eventually announces successful application of its drug, you will have lost money.

#ebola, #volatility, #risk, $TKMR, #tekmira

August 11th, 2014: Markets See Little Upside Risk in Crude Oil

To put it bluntly, crude oil got slammed pretty hard in the past few weeks. September futures on NYMEX for crude approached a seasonal high of $110 in June. Nothing unusual there. Historically speaking, oil trades higher in the summer months for various reasons (e.g. peak travel, costlier gas blends, etc.). In late July, futures fell below $100 and are currently trading near $98.

Crude: Sept. Expiration


Notice the heavy sell on volume starting late July.

"Data from the Commodities Futures Trading Commission released Friday showed that hedge funds and money managers decreased their bullish bets in New York-traded oil futures in the week ending August 5. Net longs totaled 236,381 contracts as of last week, down 14.5% from net longs of 276,741 in the preceding week." (Source)

The price per barrel isn't necessarily the important nor relevant part. It's the fact that markets see little near-term risk for a price jump in crude oil. If you keep up with the world news at all, you'll remember that ISIS is currently in the midst of a military offensive and is controlling a sizable portion of Iraq and parts of Syria. Russian and Ukraine have also seen escalation in their own militarized conflict. What do these two things have in common? Both of these areas hold key strategic and logistical importance in energy production, particularly oil and gas.

Despite this, the markets don't seem to be pricing in the risk of these events on oil prices. Let's look at the volatility chart for the S&P Crude Oil Index (OIL):


S&P Crude Oil Index ETN (OIL). Red: IV30, White: HV30
Taking a look at the 30-day forward looking implied volatility, the markets expect less volatility in oil prices now than most times in the past two years. This in spite the fact that the past two years saw little militarized escalation of the magnitude we are currently experiencing. Taking a look at the skew chart confirms this:


Not only do markets see little upside risk, their expectations largely reflect a continued price drop in crude oil. One final chart I'd like to show you is the CBOE Crude Oil Volatility Index (OVX). This instrument tracks crude oil volatility, much like the VIX tracks S&P volatility.


As you can see, the OVX is not a very popular instrument with very little volume in the past year or so. However, the implied volatility of the index jumped from 0 to 40 sometime in May indicating a bullish ante on the volatility of crude prices. Since then, the volatility has dropped minutely, but I think that someone at the Chicago Board is expecting some instability with oil in the coming months.

Sunday, August 10, 2014

It's All Greek to Me: Options Delta (A Practical Guide)

In this series, I will give a brief overview of the option greeks. These values underlie options pricing in accordance to the Black-Scholes model. I'll try to describe how these apply to option valuation in the real world and some rules of thumb for using these values.


The most basic greek of an option is its delta. The delta is the numerical amount that the option's value increases or decreases relative to movements in the underlying stock. The delta can range from .00 to 1.00. An option that is deep out-of-the-money will have a delta closer to .00, indicating that its value will hardly change with movements in the underlying. Deep in-the-money options hold deltas closer to 1.00, indicating that the option's value will increase uniformly with changes in the underlying.

When you buy an option with a high delta, you are in essence paying a premium for the increased probably that the contract will expire in-the-money. Let's look at an example:


Options grid for Apple with an expiration of (7) days with AAPL trading at 94.74

The option with the highest delta that is also out-of-the-money is also known as being "at-the-money". The 95-call and 94.29-put would be at-the-money in the above grid. These contracts command a high premium despite the fact that they are out-of-the-money. This is due to the fact that the markets place a high probability that these contracts will eventually expire in-the-money.

A large portion of the premium for these contracts is derived from its delta. An option buyer purchasing an at-the-money contract may justify the premium for the high probability that the option won't expire worthless. Had the buyer bought an option at a strike further out-of-the-money, they run the risk of the contract expiring worthless and losing the entire premium payed for the contract. On the opposite side of the contract, a seller of the contract is seeking to collect a high premium for the increased risk of the option expiring in-the-money. So we arrive at our first rule of thumb.

1. An options delta roughly translates to the probability that the contract will expire in-the-money.

Notice the call option delta for the 95 strike. The market is placing a 45% probability that Apple will be trading at or above $95 in seven trading days. The same put option indicates that there is a 56% chance of Apple trading at or below $95.

At-the-money contracts have among the highest appreciation potential amongst any of the strikes. However, for the very same reason, these contracts also expose the buyer or seller to the highest amount of risk. The underlying must move in that exact direction in a relatively limited amount of time for the option trader to profit off the contract.

Now let's look at the 95 strike straddle. The summation of the absolute value of the deltas for the call and put options at this strike is approximately 1, or in other words, there is a 100% chance that Apple will be trading at a value above, below, or at $95 in 7 trading days which intuition tells you must be true.

The straddle of that strike also gives you another piece of valuable information.

2. The price of the straddle of the at-the-money strike will give you the approximate range at which the markets predict the underlying will be trading by the time of expiration.

I want to emphasize that this rule only applies for at-the-money straddles (in the above example, the 95-strike and 94.29-strike). Let's apply this rule:


The price to buy the straddle at the 94.29-strike costs $2.23. The price of Apple when I queued this order was $94.74. We can then extrapolate that the markets expect Apple to be trading between $96.97 and $92.06 in seven days.

This range also approximates the amount that the markets are "pricing in" to a contract. This concept of "pricing in" is one of the most fundamental ideas underlying derivatives. We'll explore this concept, also known as volatility, in the next part of this series.

Tuesday, August 5, 2014

The Only Thing to Fear is Fear Itself


The VIX closed today at 16.87 with a 30-day forward looking volatility of 100.42.


The VIX has nested itself comfortably above 16, with the area between 14.5 and 15 acting as support. A few days ago, I talked about the volatility of the VIX itself (remember, the volatility of volatility). Based on the price of VIX options, one could infer that VIX contracts were trading at a premium that priced in about a 4-point move in the volatility index itself.

Put another way, sellers of options in the VIX wished to receive a premium to mitigate the risk of the VIX moving 4 points. The relative amount of risk premium that sellers wish to receive roughly translates to the implied volatility. However, as with all bidding processes, the buyer and seller must agree on a price. So not only did sellers wish to receive the 4-point move premium, buyers of VIX contracts found this to be a reasonable price.

Put even another way, if the price of the underlying instrument moves the exact amount that the implied volatility dictates (assuming all other things equal), the change in the option's volatility will offset the change in its delta and neither the buyer nor seller will have profited nor lost off the transaction.

 Below is a chart of the VIX's implied and historical volatility.

Red: IV; Blue: HV
The current implied volatility of the VIX prices in about a 4.5-point movement. As you can see the implied volatility has hit levels that are high relative to a majority of this year. Of course, this isn't really surprising considering the fact that the world is currently in a somewhat precarious environment. "Somewhat" is obviously only my opinion, but considering the following:

The last time the VIX reached these levels was earlier in January. At that point and time, there were looming concerns of our national productivity due to the harsh winter and also general uncertainty about our greater economic recovery.

Fast forward to July. The market generally agrees that the economy has recovered or is undergoing a significant recovery, better economic figures are printing, and Wall Street is buying overall positive Q2 earnings.

However, taking a look at the implied volatility of the VIX shows that fear has been building for quite some time underneath the surface. Even at the VIX lows that approached single digits earlier in July, the implied was quite elevated, indicating that markets were still concerned about some looming risk and willing to pay a premium to hedge that uncertainty.

At the end of today's trading day, Aug 5th, we have much more to worry about than we did a few months ago. Geopolitical instability has erupted at a global level. A global superpower threatens to invade Ukraine, violence erupts once again in the Middle-east, concerns of an Ebola outbreak in Africa spread to America, the western United States is experiencing the worst drought in recorded history, Argentina is on the brink of default, five years of quantitative easing are finally come to an end, and markets are bracing for an eventual increase in interest rates.

According to the current level of the VIX, these factors cause the greater markets to price in a 5% move in the S&P within 30 days (which is a decently sized move relative to how the S&P has been moving) and the VIX itself to move in the approximate range  [12, 21].

Depending on one's perspective, the VIX may be overpriced and this would present a good shorting opportunity. After all, fears of global instability have threatened humanity for thousands of years and here we still are (myself currently enjoying a nice cup of coffee inside an air conditioned coffee shop). Another perspective may be that recent global events are a bigger cause for concern than where Wall Street currently prices it and that this may be the perfect opportunity to be long on the index. And finally, one could also believe that markets are efficient and the VIX is exactly where it should be.


I'll try to provide a technical analysis in the coming days.

Monday, August 4, 2014

Visualizing Risk and Volatility: A Catastrophic Approach


"I like this concept of “low volatility, interrupted by occasional periods of high volatility”. I think I will call it "volatility". - Daniel Davies
Risk and volatility are rather abstract concepts. They certainly exist in the world, but don't readily manifest themselves in tangible ways. If you get in the car after several beers, you have a mental representation of the risk you are exposing yourself to (e.g. getting pulled over or into an accident) but these possible future outcomes only exist in an abstract space.

I equate this abstract space with Euclidean space. Euclidean space contains dimensions in a similar fashion to the Cartesian space we use in Newtonian physics. Newtonian physics models the behavior of physical systems with dimensions x, y, z, t (representative of left-right, up-down, towards-away, time). However, in the Euclidean system, these dimensions are generalized to n dimensions (the x-axis would be generalized to dimension 1, y-axis to 2, etc.) allowing one to model abstract concepts like risk, volatility, and even subatomic particles. Taking this space, we can create some interesting models of market behavior.

 
Rene Thom's catastrophe theory applied to market behavior.
Above is an interesting visualization of greed and fear in the markets using Rene Thom's catastrophe theory. Rene Thom was a French mathematician who created these landscapes to graphically model catastrophic events. This model would exist in a theoretical Euclidean space, with two dimensions representing "fear" and "greed" as shown on the control surface and the third representing market behavior. To utilize this graph, one would pick a point on the control surface (the square base) and move upwards to the spot directly above it on the "equilibrium surface".

For instance, let's look at that spot on the upper left corner of the control surface indicated by the letter "c", which happens to be on the "fear" half of the surface. This half represents all the possible degrees of fear in the markets (e.g. slight to extreme). Go upwards and see that point "c" represents the amount of fear that corresponds to declining equity markets.

The fascinating (and most important) part of this model however are the points closer to the triangular object on the control surface. It might not be immediately obvious, but that curved triangular object is actually the "shadow" of the folded section on the equilibrium surface above it. Let's take a closer look at this section.

For any point on or inside this triangle, notice that there are two corresponding points on the above equilibrium surface, one that is indicative of bullish behavior and the other bearish. (Also notice how the fold can be described with a polynomial, which often have 2 or more solutions). Within this area, we arrive at catastrophe.

Thom refers to this area as the "cusp", as in, the cusp of catastrophe. At any moment within the cusp, market behavior could spontaneously change from bullish to bearish and from greed to fear. We observe this in the markets. A buying stampede on an earnings beat can change to a selling panic from news of geopolitical instability almost instantaneously.

Specifically, the tip of the triangle is the cusp. When directly on that point, the market is in a delicate balance between greed and fear. They are on the cusp of falling in either direction. Some of you may be familiar with the Minsky Moment, which oddly, can be described as a cusp catastrophe.

Why are these sudden changes in behavior important to the derivatives trader? Cusp catastrophes cause extreme volatility in financial instruments.


The financial disaster of 2008-9 can be seen as a cusp catastrophe, where market behavior bifurcated on concerns of economic collapse. A seven year bull market lost all its gains in a matter of months and the VIX blew up to unprecedented levels. A derivatives trader long on volatility would have profited enormously if adequately posed for this cusp of catastrophe. The trick, obviously, would have been to known that this was coming.

Is it possible to predict when a market will hit a turning point? Furthermore, would it have been possible to predict the sub-prime crisis and the collapse of Lehman? Absolutely not. It is, however, possible to protect yourself from such volatility and to mitigate exposure to such risk.

The astute derivatives trader not only hedges him or herself to these events, but can seek to profit off of them.