Monday, September 29, 2014

Summer Into Fall

The S&P500 closed just south of 1978 today after trading within a 15-point range. We saw a strong late-day 10-point rally which nearly drove the index positive for the day.

Supports and resistance in $SPX

Where are we headed from here? Let's take a look at some historical and forward looking data.

September marks the end of the 3rd quarter. Taking a look back at the past few years, we've seen selling in the S&P that coincides with the end of the summer. The chart below shows the transition from summer into fall in 2013:

2013 Q2/Q3 transition in $SPX
Looking at the data from 2013, we saw a mid-September all-time high in the S&P followed by a sell-off right into the end of the month. October then saw brand new highs. We've seen similar activity thus far in the S&P this year: all-time highs in mid-September followed by an end of the month sell-off. Now let's look further back into 2012:

2012 Q2/Q3 transition in $SPX
In 2012, we also saw mid-September all-time highs in the index followed by a sell-off. An attempt at a new all-time high started several days before October but stopped just shy of it.

2011 tells a different story in the S&P500:

2011 Q2/Q3 transition in the $SPX

Going into fall 2011, the index saw nearly a 250-point drop from July to August which had traders and money managers a little more reluctant to attempt all-time highs in September. We did however see a decent sized rally in mid-September followed by a sell-off that coincided with the end of the month.

In 2010, the S&P saw a nearly uninterrupted rally right into Q4 with only some minor pullbacks at the end of September:

2010 Q2/Q3 transition in the $SPX

What can we take away from this data? First of all, this sell-off we are experiencing in the US indexes seems to be typical of market behavior during this time of year. Of course, the magnitude of selling depends highly on the environment. In 2010, we were still in the early stages of quantitative easing. So looking back at the data from that year, we can perhaps see why the markets saw a rally straight through October. As the years progress, we've seen a trend of increased selling in the summer to fall transitional period that intuitively makes sense as the Fed's money policy begins to tighten.

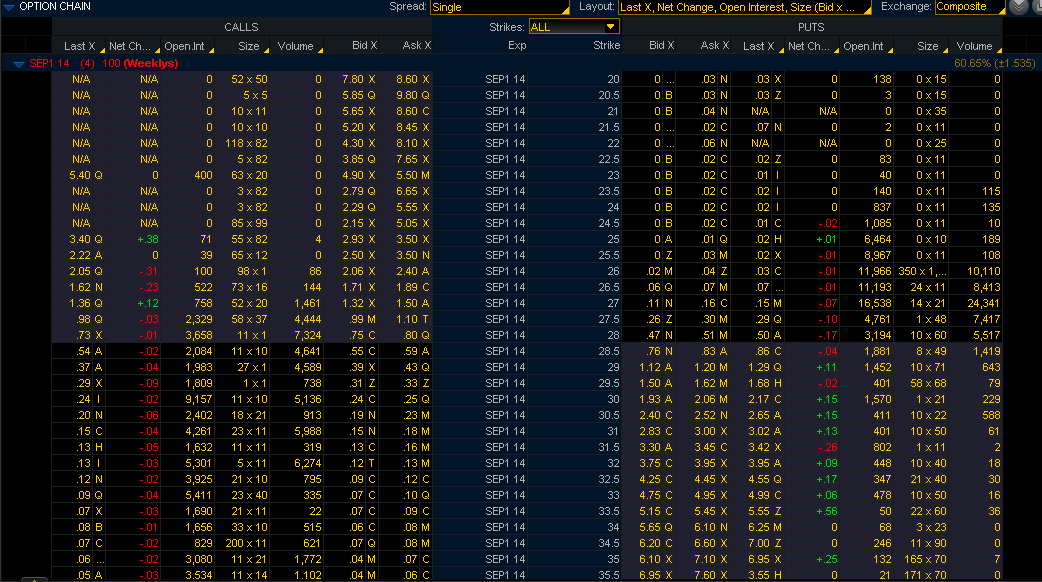
So what can we expect for this year's September to October transition? Let's take a look at the option skew in $SPY based on today's sales:

The quarterly expiration for $SPY
By the end of today, traders seem to have developed some optimism in the S&P. We see a well defined parabolic skew in option sales which indicates equally bullish and bearish bets on the index by the end of tomorrow's trading day (and the end of Q3).

In the past weeks when the S&P was entrenched in the 2000 level tango, I showed you option skews in the index which showed only pessimism in the future direction of US markets. The following $SPY skew is from earlier this month (Sept. 9):

$SPY option skew from September 9

The above skew is a nice example of market pessimism. A few days before September 9th, we hit a new all-time high in the S&P of 2011.00 which had the markets a little frightened. We did see a slight pullback in the days following only to see another all-time high of 2020.

So taking a look back at today's option skew in $SPY, we can extrapolate that traders are a little more optimistic especially in light of the much needed pull back from those all-time highs.

Finally, let's take a look at what the $VIX has to say about all of this:

Volume bars - Green: Calls sold; Red: Puts sold
The VIX rose a whopping 7.6% today with an even greater increase in the implied volatility. The volatility of volatility rests just south of 100, which historically speaking, represents a higher value than 60% of the time in the past 52-weeks. Despite the bullish bets made on the markets today, the VIX implies a lot of anxiety still lurking beneath the surface.

Please exercise caution when trading within an environment of elevated volatility, and as always, good luck tomorrow.

Sunday, September 21, 2014

So What Now?

The fat lady finally sang last Friday when $BABA was unleashed onto NYSE. Shares rose as high as 33%, pushing up the S&P500 to an all-time high near 2020 and the Nasdaq to a post-2001 high of 4580. Some big players took this opportunity to take some handsome profits:

Current levels of support for $SPX. First support to watch: 2007.5
So what now?

Let's take a look at some option skews:


The skew for $SPY shows two possible scenarios for this week. Some traders are betting on upside action in the S&P500 up to the 201 level, which translates to 2013.00 in the $SPX. This level is also the 50% retracement of last Friday morning's highs.

Most traders are seeing sell-offs up to 199.5 in the $SPY, which would translate to 1990.00 in the $SPX. Puts in the index outsold calls 2:1.

On the volatility front, the $VIX got slammed to just slightly north of 12.00 last week after spending considerable time above its 50 and 200 day moving averages. The dip in volatility coincided with the September monthly expiration in the VIX which I talked about last week. We wouldn't want those calls to expire in-the-money would we?

Let's take a closer look at market volatility:


Traders took the opportunity last Friday to buy calls in the VIX with calls outselling puts 15:1. The 30-day forward looking volatility (red curve) retraced its August lows, presenting a good opportunity for volatility speculators to buy contracts in the index for a relatively low premium. Interestingly, the 10-day historical volatility finally surpassed the 30-day forward looking volatility, while the 30-day historical volatility converged with the 30-day forward volatility.

According to the Stock Trader's Almanac, the week following Sept. expiration is historically the worst performing in the S&P, Nasdaq, Russell 2000, and Dow Jones.

Since 1988, weekly declines average from –0.88% for NASDAQ to –1.43% for Russell 2000. S&P 500 has only posted full-week gains five times in the last 26 years.

They speculate that this is due to managers re-adjusting positions ahead of quarterlies. As always, please remember that indexes do not go straight up or straight down. Hedge accordingly.

Monday, September 15, 2014

All Quiet on the Western Front

Today was the 5th anniversary of the collapse of Lehman Brothers and the markets were all quiet on the Western front.

Today's front page of Google Finance
A quick glance at Google Finance's front page showed lackadaisical sideways action in the US indexes interjected with headlines of Alibaba's IPO, which is apparently showing such "strong demand" that the offering has been raised even higher.

A glance at the high beta momentum ("mo-mo") stocks showed a different story today:


$TSLA -10%, $NFLX -4%, $FB -3.75%, $TWTR -5.25%

It's almost as if the big players suddenly became lucid of the risk that US markets face and wanted to quietly take profits without causing the public much alarm. A quick glance at the S&P500 shows that the 2000 mark failed to hold on this run-up:


Notice a cross-over on the moving averages and that all major supports for this rally, save for 1984-1982 have been breached. Let's take a look at the options skew for $SPY:


We usually see some optimism in $SPY skews which is represented by a parabolic risk curve (also known as a volatility "smile"). Today saw zero optimism as traders saw almost entirely downside risk. Puts in the index outsold calls 6:1. That's not to say the indexes can't go up this week, but I would certainly not put my own money (or anyone else's for that matter) on any sort of rally ahead of this week's FOMC meeting. This Wednesday's FOMC meeting presents major risk to US markets due to increased perceptions of hawkishness from Chairwoman Yellen.

The $VIX moved across its 200-day moving average today to close above 14 for the first time since middle August:

Volume bars indicate puts (red) and calls (green) sold (log scale)
The $VIX seems anxious to inch up but at the same time waiting for some events to occur before doing so. Perhaps it could be tomorrow's VIX September expiration, which also happens to be the day before the FOMC meets. Hedge accordingly.

As we head into the rest of the week, please be aware that many bulls are still stuck above levels in the $SPX as high as 2011 and that many bulls in momentum stock got burned today. Major geopolitical risk that the markets have largely ignored still looms: Scotland will soon vote for their independence, ISIS is still out and about causing trouble, the Fed will most likely continue to trim their balance sheets, and several tropical storms are building up in multiple regions of the world.

Good luck tomorrow.

Thursday, September 11, 2014

In Like a Lamb, Out Like a Lion

The S&P500 closed today at 1997.5 bringing us back to now the 12th day of the S&P 2000 tango. The 1996 level which I pointed out was the critical pivot for this dance was breached again today bringing us less than 3 points from the valuable 2000 level for the index.


Reaching 2000 tomorrow should be no problem should the indexes go up. The point to watch, however, is 2002.5 to 2004. These are critical points of resistance and many bulls have been trapped above that level since the beginning of September.

Let's take a look at the option's skew for $SPY:


Looking at tomorrow's expiration (white curve), we see a nice smirk beckoning us towards this week's close. Traders are seeing one of two possibilities for tomorrow. Puts having outsold calls today nearly 2:1, a majority of traders are seeing downside action with a possibility of a free fall past the current lowest point of support of 1982.5, down to as far as 1970.

Another group is seeing a Hail Mary all the way past 2004. Expect both or none of those scenarios to occur tomorrow. Typically, Friday's see a late day rally around 3:30PM. Also keeping in mind that Fridays are an option expiration day, we also have a tendency to see sideways action to deplete time premiums on contracts.

On the volatility front, we've seen the $VIX range bound between its 50 and 200 day moving averages for the past 3 sessions:


As the S&P has been range bound for the past 12 days, the markets seem unsure of whether to go long into the rally or cash out their positions, which has led to the sideways actions of the past two weeks.

The 10 day realized volatility (white line) has been relatively suppressed since June but has been inching to go up in the past few days. The 30-day forward looking volatility has been flat.

As we all know, volatility is mean reverting. Periods of high volatility dissipate back to low volatility, while periods of low volatility periodically get interrupted with high volatility or as Daniel Davies would say:

“I like this concept of “low volatility, interrupted by occasional periods of high volatility”. I think I will call it volatility."

When volatility will again occur is simply a matter of time but as the old saying goes, "In like a lion, out like a lamb" (and vice versa).

Taking a look at $VXX, or the iPath Short Term Volatility ETF, we've seen lately an upward trending environment in near-term forward-looking market volatility:


The price action has been inching above its moving averages but was slammed down at today's close below its 30-day and with the 60 and 100-day averages acting as support.

Crude Oil futures dipped below the critical $93 support yesterday,which buyers took as an opportunity for bargain-basement prices for contracts.


Prices in crude oil and equity markets are often times inversely related, but not always. If crude oil maintains above $93, look out for a period of market inversion.


As always, good luck tomorrow, and watch for those critical S&P500 levels I pointed out earlier.

Tuesday, September 9, 2014

It Ain't Over Till the Fat Lady Sings

The S&P500 finally rejected the 2000 level after spending 11 days trying to hold the line. After $AAPL failed to please the Street, we saw a 10 point free fall in the index with 1986 acting as the first level of support:


Where are we headed from here? Let's take a look at some option skews:


For the remainder of the week, a majority of traders, based on option sales, are expecting further downside action to levels as far as 1970. Another group is betting on a rally back to the highly significant 1996 pivot.

Yesterday I talked about a trading rule straight from the CME Group (formerly Chicago Merc, CBOT):

The S&P tends to make a low on the Thursday or Friday the week before the expiration (more so on the quartiles). The rule is to look to buy weakness on that Thursday or Friday, looking for a low to hold into Monday or even into the expiration itself. Generally, the trade is to buy on Friday and hold into Monday. (Pit Bull's Low)

This is a rule-of-thumb and remember these should not be construed as 100% predictive of the future. However, do consider this factor for the remainder of your trades for this week.

The $VIX increased nearly a full point today and has for the first time since mid-August moved above its 30-day moving average:


 The VIX implies a 3.9% movement in the S&P500 in the next 30 days. This translates to about 75 points, which if realized, would bring back the index to about 1910, or right where we were before this incredible 100 point rally.

Remember that markets do not go straight up or straight down but it would be wise to hedge against volatile downward movements from a much needed consolidation in this current rally. Big players have already started to take profits as the Fed trims its balance sheets in October.

The largest company (by market capitalization) $AAPL has been seeing large profit taking in the past few days:


Heavy sell-side volume has dominated Apple's price action since the 3rd of September. Today's event failed to impress the markets as all announced products were practically already known months ahead of time and priced into the stock. Many "Apple-stock-price-to-the-moon" enthusiasts are now trapped at levels high above today's $98 close (some as high as $103.50).

As buyers of this current rally are exhausted, more and more bulls are being trapped at increasingly difficult levels. Let's remember that we had many buyers of $SPX at levels between 2000 and 2010, which is now pretty distant from today's 1986 close.

But it ain't over 'till the fat lady sings. This fat lady being Alibaba ($BABA), which will be pricing its IPO next week. Alibaba is currently being priced to be the largest IPO in US market history, which from one perspective can bring new buyers into US indexes. Another perspective could be that this offering might find more bulls to be trapped at these index all-time high's.

Please be careful this week and good luck tomorrow.

Monday, September 8, 2014

Fools and Dead Men

The S&P500 closed today just north of the 2000 millennial mark, making today the 10th consecutive day that the markets have wrestled with this level. Last week I mentioned that market sentiment was largely bearish in regards to this major milestone, and indeed, we did see major sell-offs at and above this level:

Major resistance: 2002.5; Pivot: 1996; Support: 1992-ish (To be determined)

The markets have accepted $SPX at 2000, but have strongly resisted 2002.5 to 2004, which I now regard as the major levels of resistance. Last Friday, we saw an 18 point rally on news of a (temporary) truce between Russia and Ukraine, however, $VIX continued to remain cautious:


In the past several days, we've seen increased put volume in the volatility index relative to the month of August but please be aware that call volume still remains high. Ten continuous trading days near the 2000 level caused a severe dampening of the 10-day historical volatility (white line), but as we all know, volatility is mean reverting, so expect markets to push above or below the millennial mark in the coming weeks.

Currently, options sales in $SPY indicate strong downside sentiment in the index with a minor chance of a rally this week to the major point of resistance at the 2002.5-2004 level:


It is said that only dead men and fools can't change their mind. As we continue into the week, be aware that market sentiment can drastically change. Do not discount a rally past the 2002.5 mark, as any positive news could easily push US indexes higher. Many bulls are still trapped at levels as high as 2010 from last week's false break-out, and the Fed's monetary policy is still conducive to further upside.

Heavy put-side volume/open interest may also warrant a short-squeeze as we approach September's expiration.


One "rule-of-thumb" straight from the CME Group warns that we see a low in US indexes the week prior to monthly expiration:

This is a Pit Bull trading rule. The S&P tends to make a low on the Thursday or Friday the week before the expiration (more so on the quartiles). The rule is to look to buy weakness on that Thursday or Friday, looking for a low to hold into Monday or even into the expiration itself. Generally, the trade is to buy on Friday and hold into Monday. (Pit Bull's Low)

According to this rule, we should expect an S&P500 low later this week, which should not come entirely as a surprise to any of you considering we have yet to pull back from this current 90-point rally in the $SPX. However, be aware that rule-of-thumbs are never 100% accurate.

Major wild-card risk events loom this week: Apple is to hold an unveiling of new product(s) tomorrow, which should see the release of the iPhone6 and perhaps something else. $AAPL is currently sitting at very high implied volatility and markets are pricing in the unveiling of something completely unexpected that will either drive the stock's price up or disappoint and move price down.

Red: IV30 Blue: HV30
Someone well acquainted with the markets should also expect the possibility that stock price may not even move at all. Hedge accordingly.

Finally, Alibaba ($BABA) is to price it's IPO next week, and this event may be one of the largest IPOs in US market history. Expect this upcoming event to add momentum to the currently lethargic markets.

Good luck tomorrow.

Thursday, September 4, 2014

2000: An S&P500 Odyssey

Today the S&P500 rejected the psychological and technical level of 2000 and closed the day just north of 1997.5

My resistance/support and pivot levels for the S&P as an added bonus

A few days ago, I talked about the fact that the markets were largely betting on a rejection of the 2000 level, which this week's price action seems to be thus far confirming.

Traders took the opportunity this week to use the 2000+ level in the S&P500 to take profits. The most notable was yesterday's false break-out in which the S&P briefly rallied to a morning high of 2009, which was later rejected on high sell volume. Today saw similar price action in which the 2011 level was used to take profits.

The largest US company by market capitalization (i.e. $AAPL) saw very heavy profit taking this week:


A quick look at price action on the 3rd of September shows nearly 15 million shares dumped (i.e. market order) to lock in profits. This isn't ma' and pa' in Topeka, Kansas unloading 15 million shares of Apple in one day. A wild guess would say that Goldman Sachs in Manhattan, for example, would be a more likely culprit.

Back to the S&P500. Spreads in option sales for $SPY showed some slightly bullish sentiment for tomorrow, but markets appear to be more bearish for the end of this week:


A look at the risk skew for $SPY reveals something interesting:


Traders are betting on one of two things for tomorrow: The S&P500 will see a rally, breaking the 2000 support and possibly finishing up to the 2002-2004 technical levels. Other traders are betting on a sell-off up to the point of first technical resistance, which I would estimate around 1994 and another down around 1987.

However, the story for next two weeks seem to be almost entirely downside price action in the S&P (the orange curve).

Weigh the possibility of both things happening tomorrow. Sellers will use a potential morning rally near and above the 2000 level to provide liquidity, and later will use mid-day dip buyers to provide further liquidity to lock in profits.

Be aware that many bulls got trapped this week at the 2004-2011 levels in the S&P, and a capitulation by tomorrows expiry may add to further downside activity in the index.

Heavy selling in high-risk sectors this week may indicate an upcoming period of consolidation. In addition to tech stocks, biotechnology saw heavy profit taking today:


Please remember that stocks and ETFs don't go straight up or straight down, but today and yesterday showed strong signals of an upcoming consolidation period for the near 100-point, two week rally in the S&P.

The $VIX increased a quarter-point today and has been indicative of increased risk-hedging by traders and fund managers this week:

Red: IV30    Blue: HV30   White: HV10
Good luck tomorrow.

Tuesday, September 2, 2014

Atlas Shrugged

The S&P500 has shrugged around the 2000 level for a full week, which discounting the Labor Day weekend, translates to five full trading days.

Volume: Green: Calls; Red: Puts (Log scale)

The burden of geopolitical instability weighed down on market optimism today despite a late-day market rally and the Nasdaq finishing firmly in the green. The $VIX increased a quarter point with calls sales outpacing puts nearly 10:1.

Will the S&P500 hold the 2000 level?


Puts outsold calls in $SPY by more than 3:1 today. Based on the spread of sales in out-of-the-money contracts today, the market is saying no:


 One final chart I'd like to show is the Eliades New TRIN courtesy of market-harmonics.com:


"The rule of thumb is that a move from below .80 to above .80 signals that selling is likely within the next few days." (Link to description of TRIN)

Please remember that geopolitical risk still looms around the corner and that markets have strongly shrugged it off. Good luck tomorrow.

Monday, September 1, 2014

It Takes Two to Contango

The nature of the VIX is to be in perpetual contango. As an asset to hedge against downside market volatility, you can be damn sure that market makers will be charging a premium now for buyers to have portfolio peace of mind in the future.


The landscape of fear

Today's market is pricing in yesterday's fear. Of course, today is not yesterday, but Wall Street utilizes the approximate past to price the proximate future:


The landscape of tail risk

The skew of $VIX option sales prices-in 2001, 2008, and everything in between. In other words, the contango between VIX spot and VIX futures reflects an elevated premium that will yield minimum profits to a VIX call buyer should a "black swan" event of similar magnitude to 2008 occur during the life of the contract.

VIX options have been available since 2006 and one can conclude that the markets have had sufficient time to discover the price of risk and volatility in this instrument.

The iPath® S&P 500 VIX Short-Term Futures ETN ($VXX) was introduced shortly after the 2008 implosion and strictly speaking in terms of price discovery as a function of time, yields greater opportunity for traders to profit off of unexpected market volatility.

The VXX allows one to go long or short front-end contracts in VIX futures. The advantage of this instrument can be seen in the fact that its prices are not necessarily a reflection of the implied movement in the S&P, but rather seems to be normalized to the volatility extremes of 2008-9:


The exponential downward movement (minus the minor volatility flashes of 2010 and 2011) reflects the new paradigm of risk since QE. Looking at the magnitude of the movement in this instrument reflects wider potential variance in the instrument. However, the VXX itself has been limited to sub-100 levels for quite some time. However, given that, a look at the options grid shows that trading this instrument can prove to be more profitable than the highly subdued VIX:


The instrument can be traded in half-integer intervals, allowing exposure to smaller movements in near-term volatility. You should also notice that the premiums of calls vs. puts do not diverge as heavily as the VIX since one's fundamental position is in short-term volatility. Having monitored this instrument myself, the VXX is highly vega sensitive. Therefore, owning this instrument also carries the responsibility of being closely monitored and also carefully timed entrances and exits.


Taking a look at the options skew above for VXX shows a less steep implied volatility compared to the VIX.

Having flirted with the 2000 level in the S&P500 for the past several days, I talked about the potential for increased market volatility based on options and futures sales last week. Having said that, please remember that volatility still has room to go down, at least until rates continue to stay low.

Good luck tomorrow.