Monday, September 1, 2014

It Takes Two to Contango

The nature of the VIX is to be in perpetual contango. As an asset to hedge against downside market volatility, you can be damn sure that market makers will be charging a premium now for buyers to have portfolio peace of mind in the future.


The landscape of fear

Today's market is pricing in yesterday's fear. Of course, today is not yesterday, but Wall Street utilizes the approximate past to price the proximate future:


The landscape of tail risk

The skew of $VIX option sales prices-in 2001, 2008, and everything in between. In other words, the contango between VIX spot and VIX futures reflects an elevated premium that will yield minimum profits to a VIX call buyer should a "black swan" event of similar magnitude to 2008 occur during the life of the contract.

VIX options have been available since 2006 and one can conclude that the markets have had sufficient time to discover the price of risk and volatility in this instrument.

The iPath® S&P 500 VIX Short-Term Futures™ ETN ($VXX) was introduced shortly after the 2008 implosion and strictly speaking in terms of price discovery as a function of time, yields greater opportunity for traders to profit off of unexpected market volatility.

The VXX allows one to go long or short front-end contracts in VIX futures. The advantage of this instrument can be seen in the fact that its prices are not necessarily a reflection of the implied movement in the S&P, but rather seems to be normalized to the volatility extremes of 2008-9:


The exponential downward movement (minus the minor volatility flashes of 2010 and 2011) reflects the new paradigm of risk since QE. Looking at the magnitude of the movement in this instrument reflects wider potential variance in the instrument. However, the VXX itself has been limited to sub-100 levels for quite some time. However, given that, a look at the options grid shows that trading this instrument can prove to be more profitable than the highly subdued VIX:


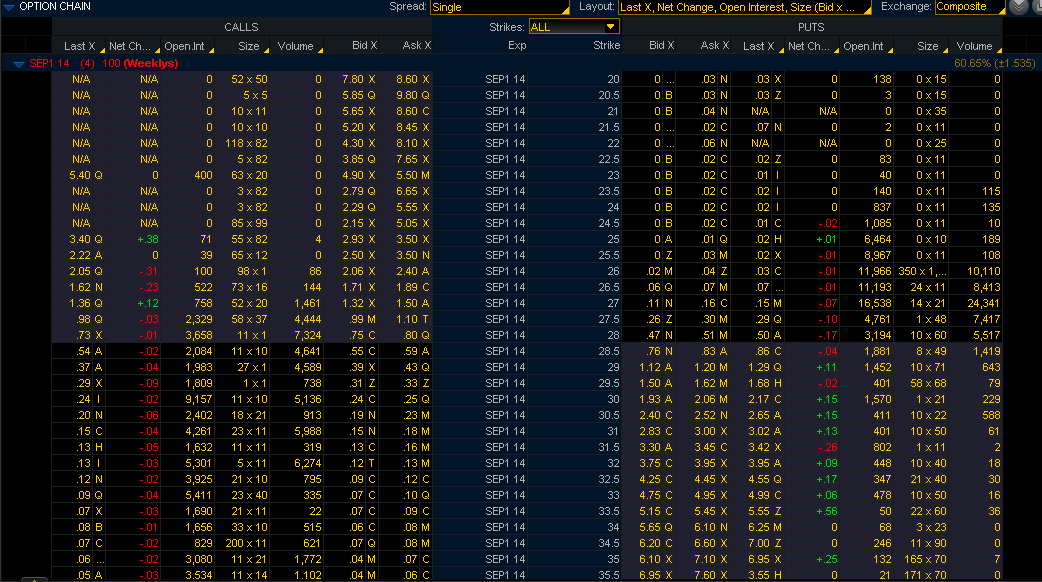
The instrument can be traded in half-integer intervals, allowing exposure to smaller movements in near-term volatility. You should also notice that the premiums of calls vs. puts do not diverge as heavily as the VIX since one's fundamental position is in short-term volatility. Having monitored this instrument myself, the VXX is highly vega sensitive. Therefore, owning this instrument also carries the responsibility of being closely monitored and also carefully timed entrances and exits.


Taking a look at the options skew above for VXX shows a less steep implied volatility compared to the VIX.

Having flirted with the 2000 level in the S&P500 for the past several days, I talked about the potential for increased market volatility based on options and futures sales last week. Having said that, please remember that volatility still has room to go down, at least until rates continue to stay low.

Good luck tomorrow.
Tuesday, August 26, 2014

It Takes Two To Tango

The S&P500 closed today above 2000 for the first time, marking a major milestone in the post-implosionary bull market of 2009. No doubt, traders are nervous of the melt upwards in US indexes as the Fed trims their balance sheets. Perplexingly, the $VIX still indicates a degree of complacency relative to the year:

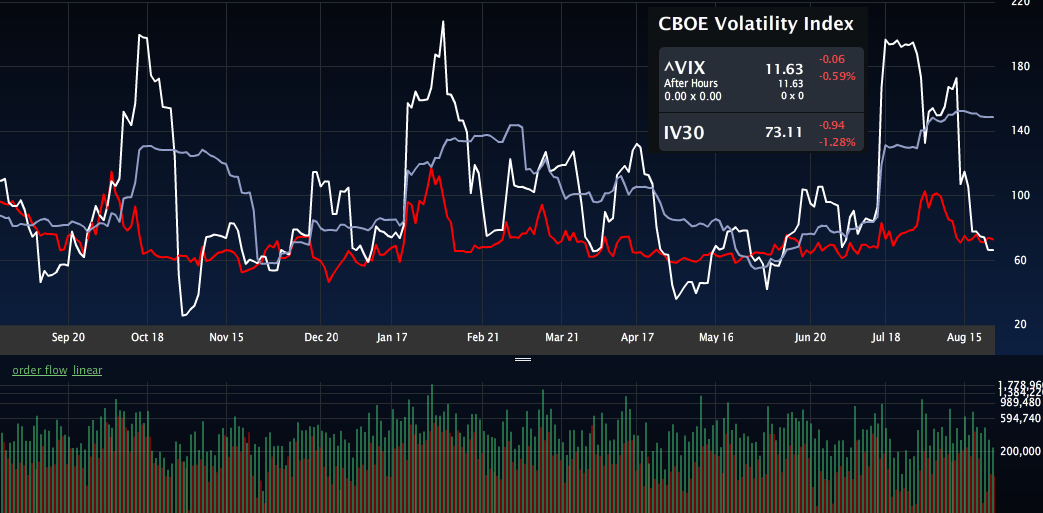
The VIX as of today's close. HV10: White; HV30: Gray; IV30: Red
The short-term realized volatility of the VIX (IV10) has retraced levels seen prior to the brief scare in July where markets become suddenly lucid of the risk that Ebola, Russia/Ukraine, and ISIS posed. Markets are not entirely discounting that risk however, as the 30-day forward looking implied volatility sits elevated relative to the near-term historical (HV10 specifically) volatility. Looking at the increasing trend of sales in put options on the fear index shows that some are willing to bet that volatility still has room to go down.

The S&P500 itself has been flirting above and below the 2000 milestone for the past two days, showing uncertainty of whether this millennial mark can maintain despite the trimming of the Fed's balance sheet and the looming possibility of interest-rate risk.

$SPY: HV10: White; HV30: Gray; IV30: Red
The sideways action of the S&P500 is reflected in the very diminished 10-day realized volatility, however Wall Street is starting to place their bets.

Below is the options skew for $SPY:


Based on options sales in the $SPY, one trader is betting on S&P upside to the 2002.5 level with the purchase of 5200 call options on the index. This level acted as strong resistance in this afternoon's trading.

Largest sales in the $SPY today

On the flip-side, a bearish ante was upped today with the sale of a 10,000 put option spread for the 19300 and 19900 levels. This trader is betting on downside retracement to the levels seen earlier this month before the magnificent 65-handle, 10 trading day rally:


From either perspective, bet on increased chop in the days ahead.

Largest VIX sales for Aug. 26, 2014
A 15000-lot 18/23 call spread was opened today for the Oct. $VIX expiry. For those of you betting on increased volatility as we head into the fall, the current 30-day implied volatility of the VIX sits near 70, which indicates that the IV30 of the VIX has only been lower 33% of the time.

Good luck tomorrow.

Sunday, August 24, 2014

An Irrationally Exuberant Approach To Biotechnology

Frothy Valuations in the Markets and You
August 24, 2014

We learn from our mistakes, at least I hope we do. Below is a chart comparing four of the biggest "bubbles" in US market history:

Courtesy of Macrotrends.com

I'm going to refrain from using the term "bubble" and instead use "irrationally exuberated price discovery". Often times in these moments, it drives rational agents to act not so rationally. Looking at the chart above, we see an almost identical explosive rise in prices followed by an equally rapid decline regardless of the asset class. There are myriad factors (known and unknown) that contribute to the exuberance but I'd like to focus on one particular case: excessive speculation.

Below is a chart of bitcoin:


We cannot deny the fact that no one really knew what bitcoin was worth last year. In a span of less than a week, we saw highs just north of $1100 and a near 50% collapse. At the time, the digital currency was, in my opinion, nearly useless. It really couldn't be used as actual currency since it wasn't really adopted. There was a single cafe in Palo Alto that accepted bitcoin but a $3 dollar cup of coffee may have actually cost you $10 the next week due to price volatility. I suppose it was good for money laundering.

So now we arrive at the biotechnology sector. Here is a quote from Yellen herself earlier in July:

Nevertheless, valuation metrics in some sectors do appear substantially stretched—particularly those for smaller firms in the [...] biotechnology industries, despite a notable downturn in equity prices for such firms early in the year.

Let's take a closer look at valuations in the small cap biotechnology sector vs the S&P500:

Price of small-cap biotech vs. S&P500. Source: Ameritrade TD

Year-to-date, Ameritrade's small cap biotech index has risen almost 20% above the S&P500. Is there a problem with this?

To answer this question, let's take a look at what the S&P500 is actually indexing.

The S&P500 is a stock market index based on the market capitalizations of 500 large companies having common stock listed on the NYSE or NASDAQ - Wikipedia

So the S&P500 essentially tracks the prices of generally well established, dividend-paying components of American markets such as Boeing, Berkshire-Hathaway, Coca-Cola, etc. Let's look at some components in the small-cap biotechnology sector:


The above list is the first page of Ameritrade's listing in the sector, arranged with descending market cap. Immediately, you notice that of the 22 companies on this page, only 8 actually have a listed P/E ratio, indicating that only 8 of the largest companies (by market cap) in this sector generate positive revenue to even have a price/earnings ratio listed. Additionally, only two companies in this entire index pay a dividend (PDLI ~ 6% and AMGN ~2%).

So why is this sector popping? Investors sure aren't receiving any meaningful dividends from these components. Instead, they are speculating on the future worth of these companies, which can pay a handsome reward if $PBYI (Puma Biotech.) serves as an example:


However, Puma is an outlier, no doubt. Not all of these companies will explode 5-fold in price overnight. In fact, a lot of these companies will fail to pass any of their products to public markets and will be acquired/liquidated at a net loss to investors.

$TKMR, Tekmira, developing a potential Ebola vaccine that barely skidded its way into clinical trials due to urgency saw speculative buying, and a lot of buyers in the stock got burned.

Notice the similarity in price action to bitcoin?

Tekmira made a public offering earlier this year at $28. That price, for a company that has yet to generate positive cash flow. It closed today at $17.74. Tekmira is typical of what a lot of the small-cap biotechnology sector currently looks like. No positive cash-flow and sky-high P/E's and valuations. Now let's look at the NASDAQ's Biotech. Index Fund ($IBB):


See a pattern emerging? The average P/E of components in this ETF is approximately 40, whereas the average P/E of all stocks publicly traded in the US is about 19. Here is NASDAQ's page on this ETF that lists some statistics and components of the fund.

If history serves as an example, I see a lot of similarities between today's biotechnology sector and the NASDAQ of the early 2000's. Investors were shooting valuations of any company with a .com domain name sky-high regardless of whether they had any sound fundamentals or even a sensible business model for that matter.

Having gone through the .com bubble, investors are of course more cautious in exhibiting such exuberance in the year 2014. However, in my opinion, I think that history may be repeating itself. Having worked in the pharmaceutical industry, I've seen many "promising" drugs fail late stage pre-clinical trials from some of the best publicly traded pharmaceutical companies. Furthermore, it's not even unusual to see drugs fail late-stage clinical trials.

In a previous post, I talked about how Wall Street "prices-in" shares in pharmaceutical companies with the assumption that their drugs will successfully pass clinical trials. If this weren't true, we would never see drastic price crashes upon announcements of clinical trial failures.

Having said that, no one can be 100% certain of what any asset is really worth. It may be the case that the biotechnology sector is fairly valued, but it also could be not. As we head into the Fall, keep in mind that 5 years of economic stimulus is coming to an end and that the risk of increased interest rates becomes more and more palpable with every passing minute.

Good luck this week.


#biotechnology, #ebola, $TKMR, $PBYI, $AMGN, $IBB

Tuesday, August 19, 2014

Tesla Contracts: Get 'Em While They're Hot

Contracts in Tesla are currently sitting at an implied volatility of 35.97, which indicates that Wall Street saw risk in owning shares in the company lower only 2% of the time since its IPO in 2010. A brief look at a chart in $TSLA shows pretty drastic price action this year, action that might suggest that options in Tesla may be underpriced.

Red, white, and blue moving averages. The three parallel blue lines outline the "trend" in Tesla.

One thing we do know about volatility is that it is mean reverting. Mean reversion is a phenomena that occurs quite frequently in nature. When the behavior of a system is displaced from equilibrium, it will tend to revert back to the state prior to displacement. For instance, a vibrating guitar string will not ring forever: after it is plucked, it will return to a state of equilibrium (which in the case of the string is "at rest").

This analogy applies analogously to volatility in markets. States of frantic selling or buying are only momentary; markets will eventually want to revert back to a state of equilibrium, or in other words, revert back to its mean. In terms of movements in stock prices, mean reversion can be seen by drawing a "trend line". I estimated the trend line for price action in Tesla with the three parallel blue lines up above. As you can see, each time price diverged from the central line, it had the tendency to move quite drastically above and below it, only to return to it.

One of my favorite assets, the $VIX, which is literally an index of volatility itself, demonstrates that it is indeed a mean reverting phenomena.


I applied a linear regression to the index. As you can see, market volatility tends to return to the central trend line of mean reversion. Irrationality transforms to price discovery which transforms to price stability as global markets learn from trial and error.

As of today, August 19th, the markets have returned to the central trend that Tesla has been wanting to revert to. Wall Street, at this point and time and with all known information regarding the company, generally agrees on a price around $255 a share.

I must re-emphasis the phrase "all known information". Tesla traded near this mark around Feb/March of this year, but at the time, there was very little information regarding its market operations in China or its soon-to-be gigafactory. A disappointing earnings report Q1 2014 caused a frantic sell-off in the stock to about $180 before markets got their metaphorical shit together and realized a bargain was at their hands. The price reverted back to its trend line in July.

Fast-forward to today and markets agree that $255 is an acceptable price now knowing of their intents in China, expansions in the US infrastructure, and production capacity. All these variables are currently "priced-in" to the stock.

However, as speculators, option traders now have one of the biggest opportunities to profit off of price movement in the company. From a volatility perspective, options in the company have only traded cheaper 2% of the time.

Notice that the implied volatility of share in Tesla also has a mean it reverts to (~50% IV)
A quick look at the implied volatility of shares in Tesla shows that options are "cheaper" than they have been in quite a while. This is for a company that many people believe can be the "next big thing", and not to mention, is very young. Unlike Apple, which has been publicly traded for decades with multiple splits, the amount of available shares in the company are relatively few. The sale of a single share in the company has the ability to move the price more drastically than shares in any NYSE component.

That being said, shares in Tesla won't implode/explode today or tomorrow, or even by the end of this month necessarily. What the take home point is that at some point, we know that volatility will increase in the company. As you may or may not know, option traders have the ability to construct a delta neutral position that exposes one only to volatility in movement and not directionality of price. But for those of you so inclined, you can "cheaply" speculate on the future price of Tesla.

Place your bets on Wall Street.

Sunday, August 17, 2014

What's In Store This Week, Lady Wall Street?

The S&P500 moved a whopping 1 point downward last Friday after seeing a high of 1964 and a low of 1942. A brief mid-morning rally that breached the critical 1960 resistance came to end when news of trucks exploding in Crimea caused a sell-off in the indexes. The 1940 level acted as support before the S&P rallied to close the day at 1955.

The week closed with a bullish bias with the the $VIX 30, 50, and 100-day moving averages acting as resistance. The 30-day forward looking volatility for the VIX rests around 84, after seeing highs near 120 in early August. The current value of VIX, 13.15, implies that the markets expect roughly a 3.75% movement in the S&P500 in the next 30 days, while the IV of the VIX implies a 24% movement in the volatility index itself.


Looking forward this week, expect some volatility from economic reports, notably the CPI, FOMC minutes, and home sales.

Sources: briefing.com, Risk Laboratory

On the Ebola front, Tekmira Pharmaceuticals ($TKMR) reported earnings last week, missing the consensus EPS estimate of -$0.26 by 2 cents to report a quarterly decline of -$0.28. Shares in the company developing the most promising Ebola vaccine dropped to $16.10 after reports of the miss, only to recover near its pre-earnings price just north of $18.00. Last week, I talked about how markets were pricing the risk of Tekmira pharmaceuticals. Based on the implied volatility, one could extrapolate a rough $2.75 movement in the stock from its pre-earnings price of $18.60. The stock did just that early Friday morning, only to see an explosion right back above $18.00 to close the week. It looks like someone didn't want the put options they sold in $TKMR to expire in-the-money.


Below is some data behind the current Ebola outbreak.


Like most naturally occurring phenomena (think bacterial reproduction, compound interest, user rate growth), the exponential increase in deaths and cases suggests that the current strain has reached "outbreak" status and does pose significant risk to the current geopolitical landscape. However, $TKMR is still currently priced with speculation that its vaccine will be succesful, but let's keep in mind that the company has yet to generate any sort of revenue. That's not to say that the stock price won't still go up, but due to the nature of human behavior and risk perception, there is still a lot of room for movement in the stock (be it upwards or downwards).

As of 8:30 PM EST, the S&P500 has yet to breach the 1960 support. Expect strong resistance at this point from last Friday's brief rally. Let's take a look at the options skew for $SPY:


Traders expect the 1960 level to show strong resistance, with strong speculation that the US indexes will kick off the week with downward action as far as 1935.5. A contrarian who bets that the S&P500 will breach 1960 may receive a handsome profit from their speculation based on the current pricing of $SPY calls.

Below is the option skew for $VIX:


The $VIX confirms that markets are weary going into the week. However, looking forward to September's expiration, one might be able to extrapolate weakening pessimism/growing optimism as August comes to a close.

Courtesy of CNN
CNN's fear 'n' greed meter shows a slight easing of fear from one week ago which the 6-point drop in the $VIX last week can confirm.

Going into this week, be cautious that geopolitical volatility may erupt like it did Friday morning. Hedge accordingly.

See you at tomorrow's opening bell.


$VIX $NDX $COMPQ $SPX $SPY $RUT

Thursday, August 14, 2014

From S&P Dusk Till Dawn

As we head into fall, the S&P500 and VIX have continued their respective churn up and retreat back. The end of the world was briefly interrupted today when Russia extended their proverbial olive branch with promises to ease aggression in Crimea, slamming crude oil futures further down 2 handles. The brief escalation in the VIX retreated back down, breaching critical points of support to close today at 12.42 with a 30-day forward looking volatility of 56.96.


The S&P advanced 45 points since last Friday, rejecting the 1910 support and spurning it upwards to the next critical point of 1960. Let's take a look at some options skews:

Options skew in $SPY
Above is the options skew for $SPY representing the weekly expirations for August. Looking at tomorrow's expiration (the white curve), we can extrapolate that Wall Street is expecting one of two things for tomorrow (Friday):

1. Traders are expecting the S&P500 to reject the 1960 level and retreat downwards with the 1945.5 to act as the first level of support. Some are pricing in the possibility of a further waver to 1935 with a 6% probability (based on the .06 delta for the weekly expiration).

2. Another group is betting on the possibility that the bulls will defeat the 1960 resistance and finish the week with a rally.

Let's look at what the $VIX has to say:

$VIX with this Friday's and Sept. expirations

The $VIX weighs the possibility of a 1960 level rejection higher than a rally based on tomorrow's expiration. Looking at September's expiration, traders are taking the position that in the slightly longer term, the S&P might be out of fuel for a rally or that some of the temporary decline in geopolitical escalation will not last.

Let's not discount the fact that this year has seen the use of a very popular strategy called the short-squeeze. With the increased level of anxiety in the markets as of late, traders have been covering their long positions with puts and shorts. The bigger players have been calling out the bluffs by churning equities and index highers, causing bears to cover their shorts.

Don't get fleeced; see you at the opening bell.


Tuesday, August 12, 2014

Tekmira Pharmaceuticals and a Lesson in Stock Volatility

Tuesday, August 12 - Shares in Tekmira Pharmaceuticals (TKMR) imploded 22% after today's opening bell with a 3.75% drop after-hours. That's a single-day drop of nearly 26%. Put another way, the market capitalization of the company fell $130,000,000 in about 10 hours and put even another way, the market's perceived worth of the company fell by more than a quarter of its total worth from the time someone drank their morning coffee to the time they left work.


Yesterday, I talked about how one could extrapolate from the options skew that the only direction shares in TKMR could go from yesterday's close of $24 is downwards. Since then, Wall Street's expectations for the company changed again. Let's take a closer look:


Above is the options skew for Tekmira at the end of today's trading day. Below is what the skew looked like before today's opening bell.


Yesterday's volatility smirk has evolved into a slight grin and maybe even a smile after today's drop of about 25%. What can we extrapolate from this?

At it's current share price of about $18, the markets are starting to believe that shares in the company might be worth more. Remember from yesterday, we could extrapolate that Tekmira is worth approximately $23 a share to the market if we assume that their Ebola vaccine will successfully pass clinical trials and be available to the public. With today's development of more perceived upside risk in the company, we can extrapolate that the markets are starting to believe shares in the company might be undervalued at $18. But there is an extra factor that I didn't talk about at all yesterday that we now cannot ignore.

Tekmira reports earnings after tomorrow's closing bell. In the theoretical word of derivatives, the implied volatility of stock options in a company should increase as we approach quarterly earnings. However, we saw a 20% decay in the IV today. This, in my opinion, was probably due to the decay of euphoria surrounding the news of TKMR's Ebola vaccine fast-track status that hit the press yesterday. However, even considering today's decline of panic buying in Tekmira, I believe that the implied volatility should have still increased.

The implied volatility roughly translates to the market's expectations of how "volatile" a stock's price will behave in the near future. Considering that, after an implosion of more than 25% in a single trading day, shouldn't the implied volatility have gone up instead of down? Also, let's not forget that since yesterday, we are now less than 24 hours away from earnings.


That, of course, is how the IV should behave in theory but we all know that theory never fully translates to practice.


Queuing the at-the-money straddle for this week's expiry, we can extrapolate that the markets expect +/- $2.75 price movement in the stock by Friday's closing bell. Really? The stock dropped more than $5.00 today alone, not to mention that the company made a public offering in March of this year for $28 a share. Yes, $28.

Keep in mind, this is not a trade recommendation. I could be wrong and the markets may be efficiently pricing the risk of $TKMR properly. But they could also be not.

Place your bets on Wall Street.


$TKMR, #ebola, #volatility